Generating Waveform Images from Audio files
October 30, 2015
A couple of weeks ago, I started talking about starting a social network for short form audio. During the process of researching for this project, we realized we needed some way to visualize the audio on the interface. Since a waveform image is the de facto visual from of audio, we decided to go with that. But then I realized,
How do I generate these images with code?
So off I went looking for solutions online. I read various blog posts about using NumPy and Matplotlib but it felt like it was a bit too much overhead for me to learn how to use scientific Python tools for my purpose.
Eventually I found a StackOverflow answer that instead uses pydub to measure the loudness of an audio file at intervals. I now had an array of loudness levels for audio files! All I have to do now is draw the waveform.
After about half an hour of tinkering with Pillow, I had the waveform!
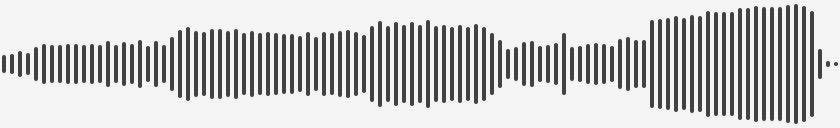
This is the generated waveform for clammbon’s Re-Chicago
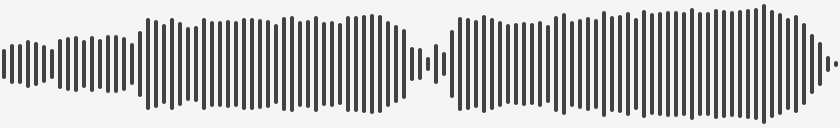
Here’s one for Re-Folklore
Here’s the script that I wrote. I decided against making it a library because you’re probably going to want to have your waveform look different anyway.
Hope this post helped.